Weather forecast is a daily driver for millions, and it is seen in the latest Android and iOS smartphone widgets. Almost everyone has one weather widget in the Home Screen, and it gives you quick information on the current weather events. Many apps and online services require weather API providers for accurate and updated information for the users. You got several providers out there, and they have plans for it. However, you can save hundreds of dollars each month by choosing an affordable provider. Let me introduce you to Visual Crossing and share important points about the service.
What is Visual Crossing?
Visual Crossing is a world-class weather forecast, API, and history data provider. The dashboard has advanced options to integrate the weather services with apps, sites, and codes. They have been around for 20 years and offer services to leading companies in the world.
Visual Crossing has equipped the service with the essential information required for the weather project.
a. Historical Weather Data
b. Historical Weather Forecasts
c. Climate Summaries
You can check out the specialty weather measures, and I have listed them below.
a. Solar Radiation
b. Degree days
c. Weather alerts.
Thousands of leading companies have subscribed to the Visual Crossing services due to the low pricing and world-class service. Let us look at the weather API provider closer and find out if it’s worth your money or not.
Download Weather Data in Multiple Formats
Downloading the weather data for the projects is seen among college students and corporate employees. The dashboard has options that let the users download the weather data in the local storage, and it is in CSV format. Let me show you the download process, and it will give you an idea of how the web-based app works.
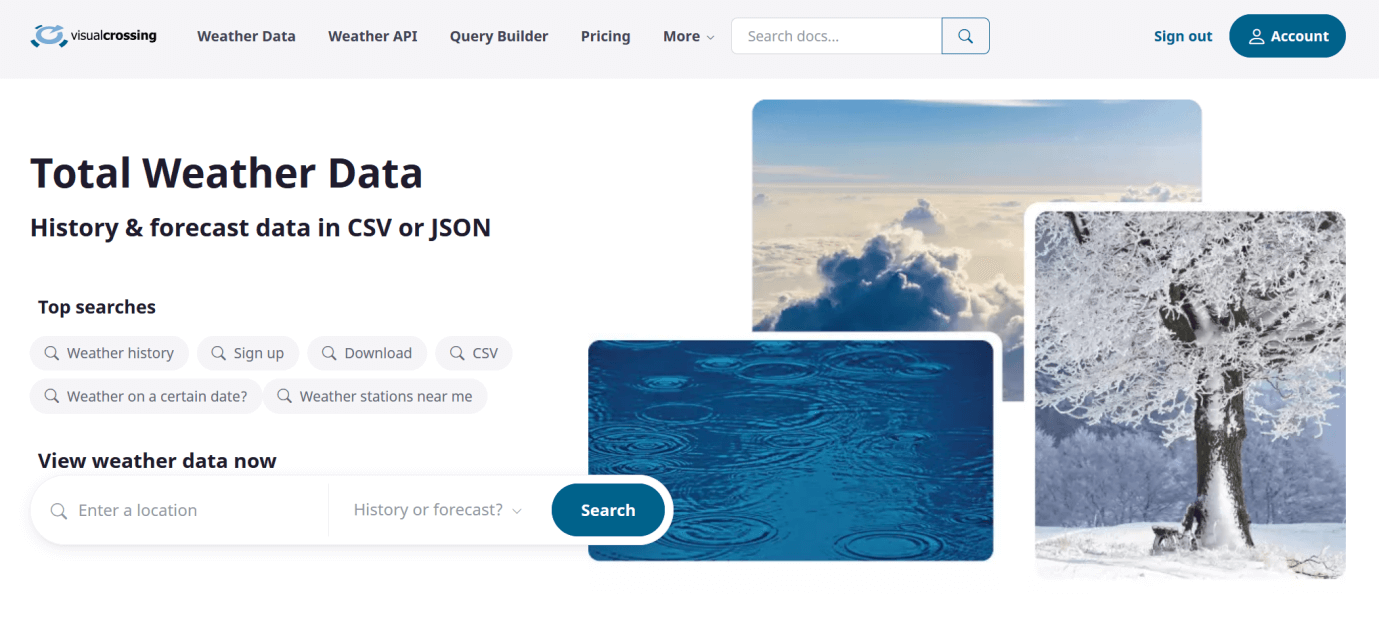
1. Open the site and click on “Weather Data” from the main menu on the top.
2. Type the location name and press the enter key.
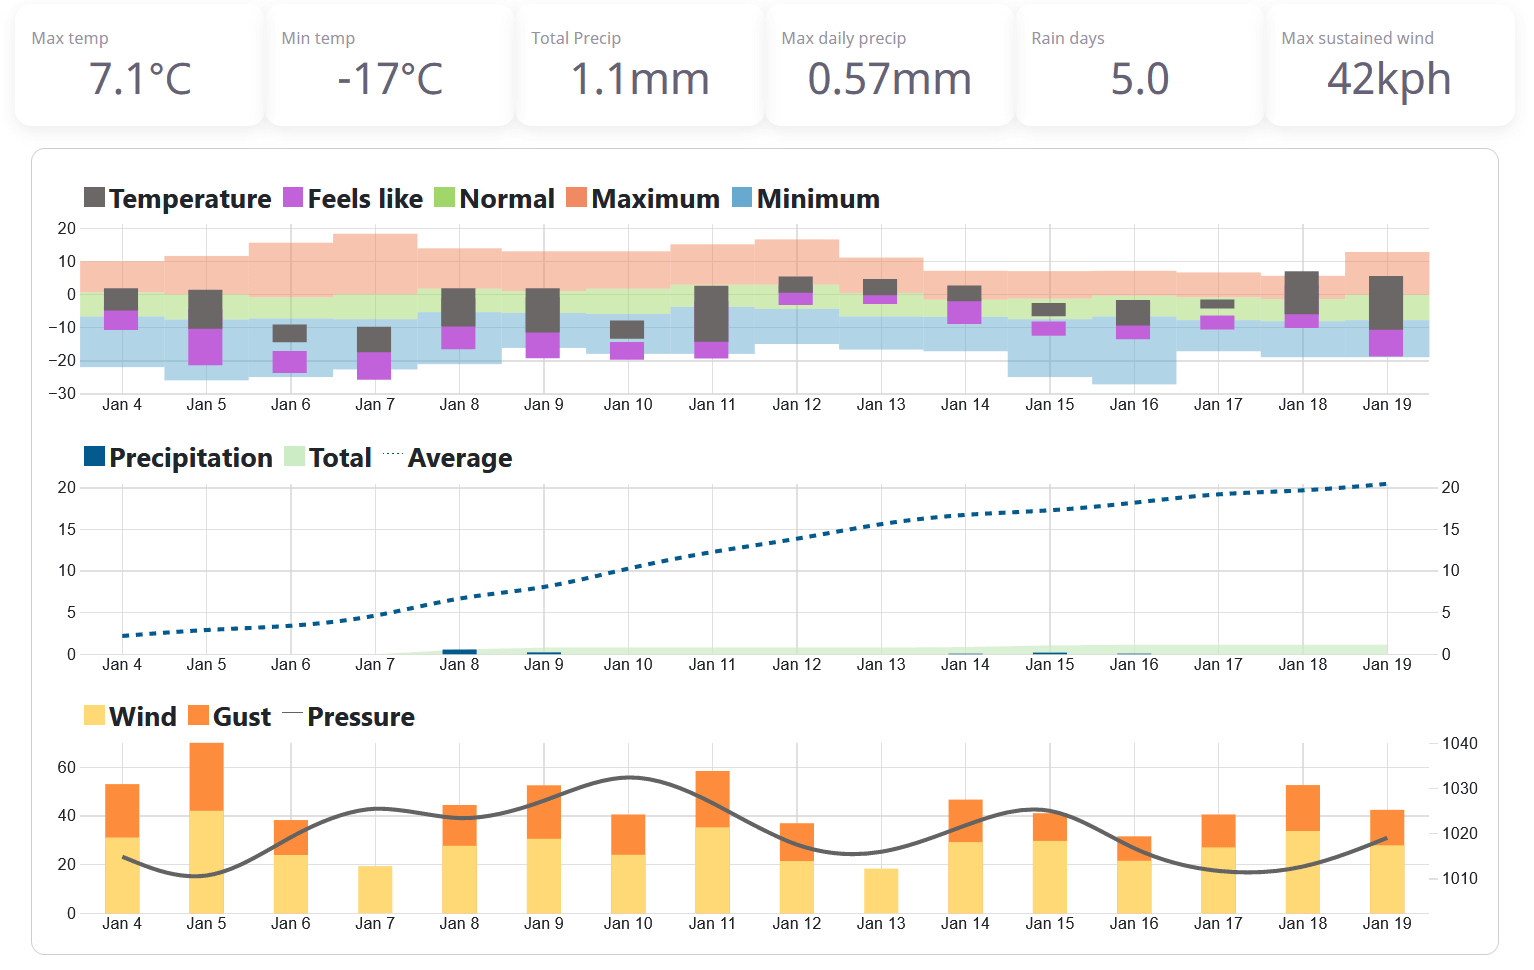
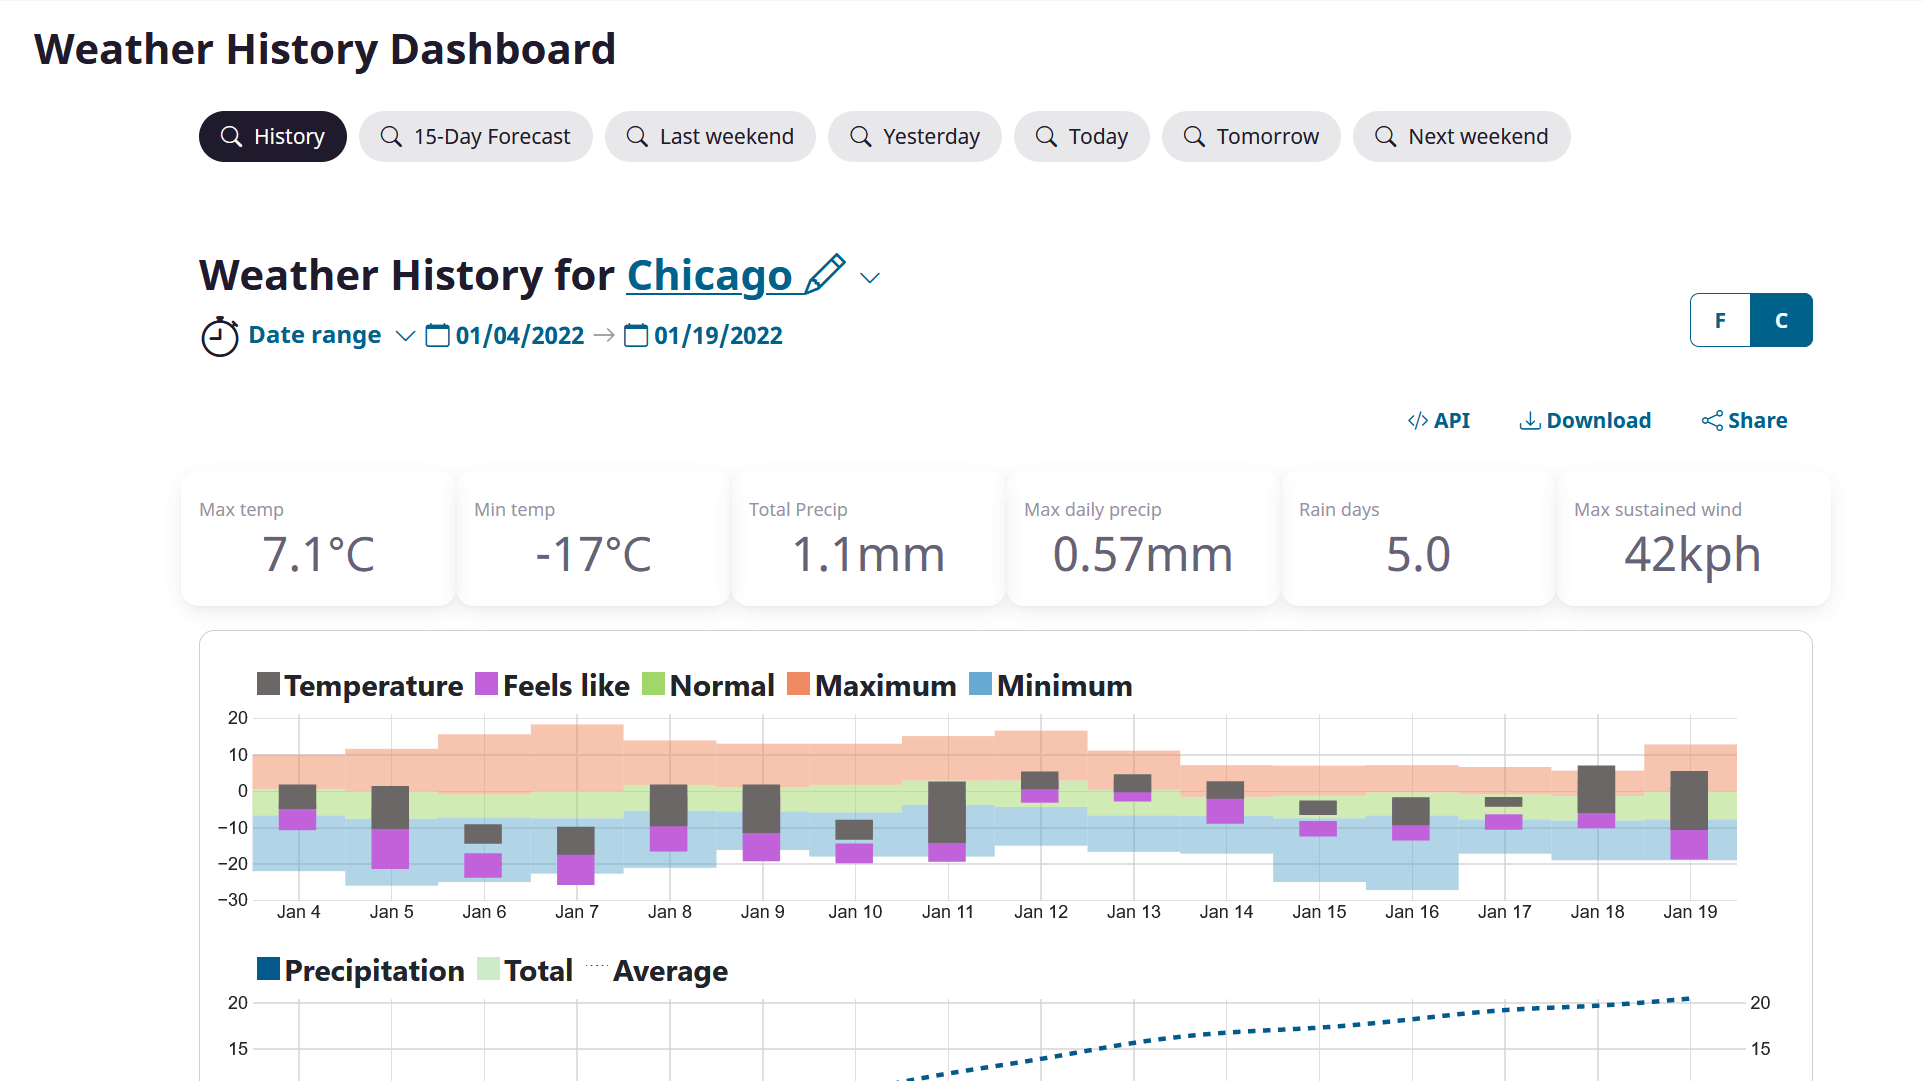
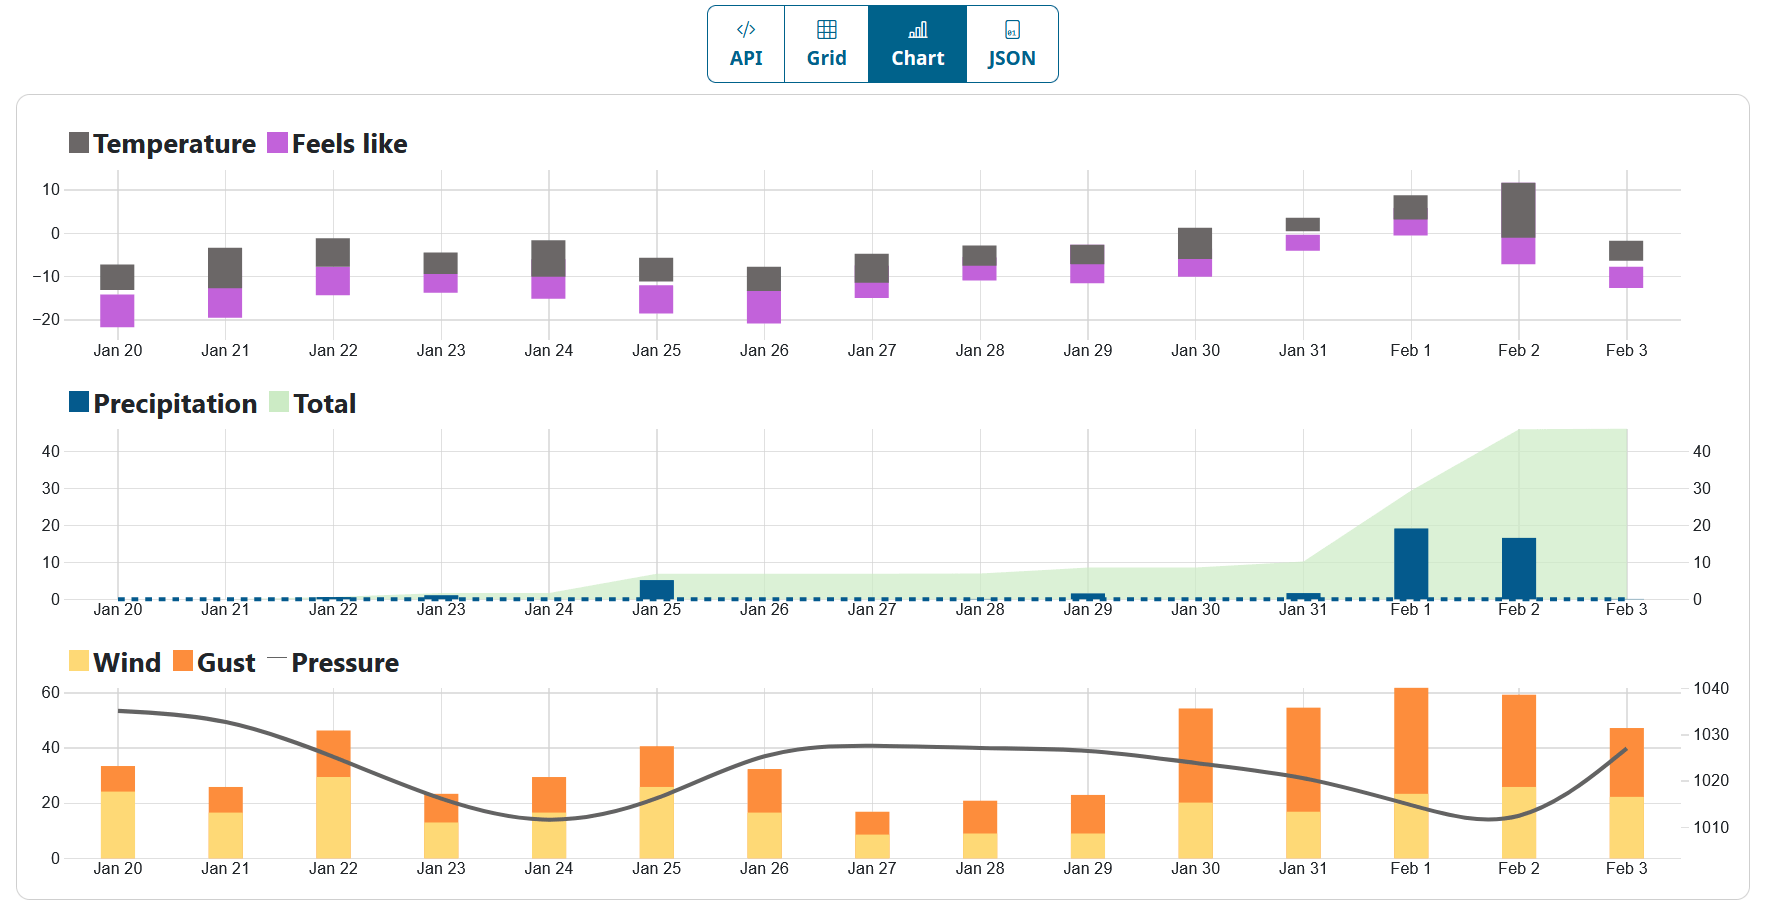
3. You can view the chart and take an in-depth look at the weather in the location.
Click on the “Download” button located on the page.
- Here’s you have a “Download” on the page and click on it.
5. Now, you have to choose the output content type and output selection.
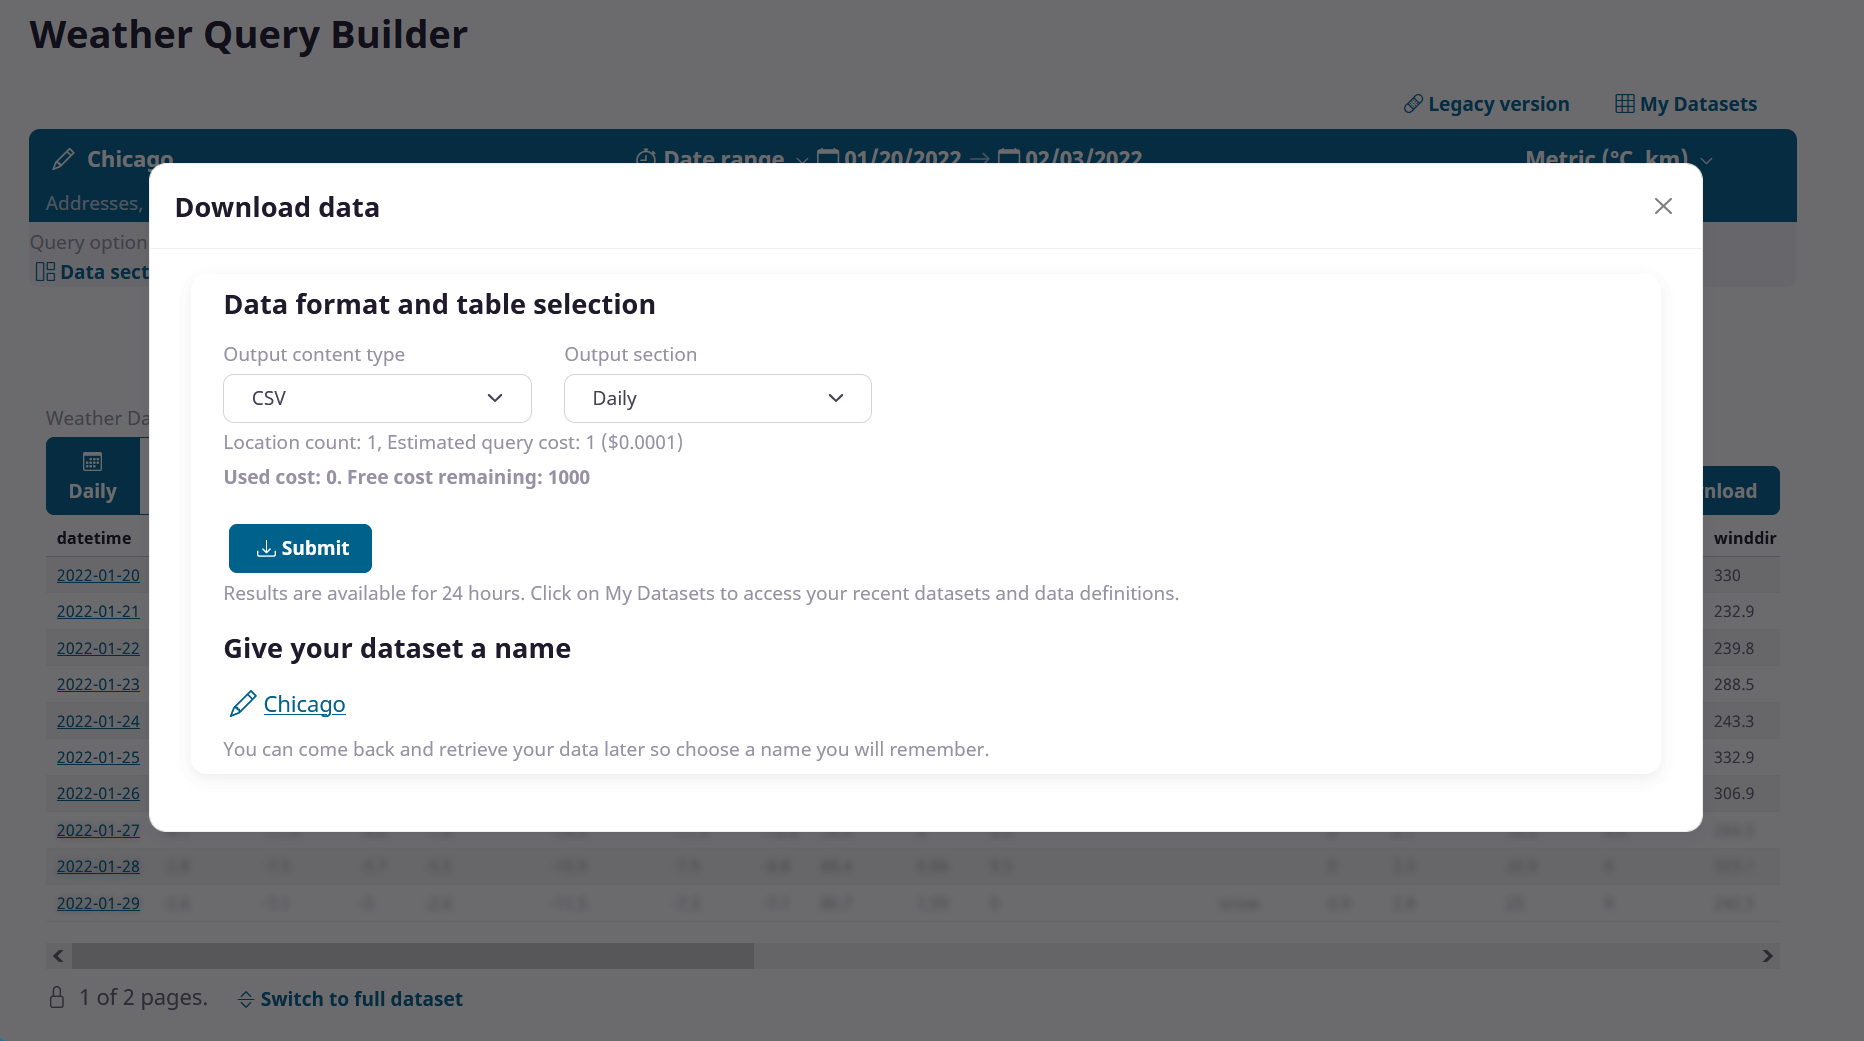
Output Content Type: You can choose from CSV, Excel, and JSON file formats.
Output Selection: You can choose from daily, hourly, alerts, current, and events.
Click on the “Submit” button to save it in the local storage.
6. The file is saved in the local storage and open it.
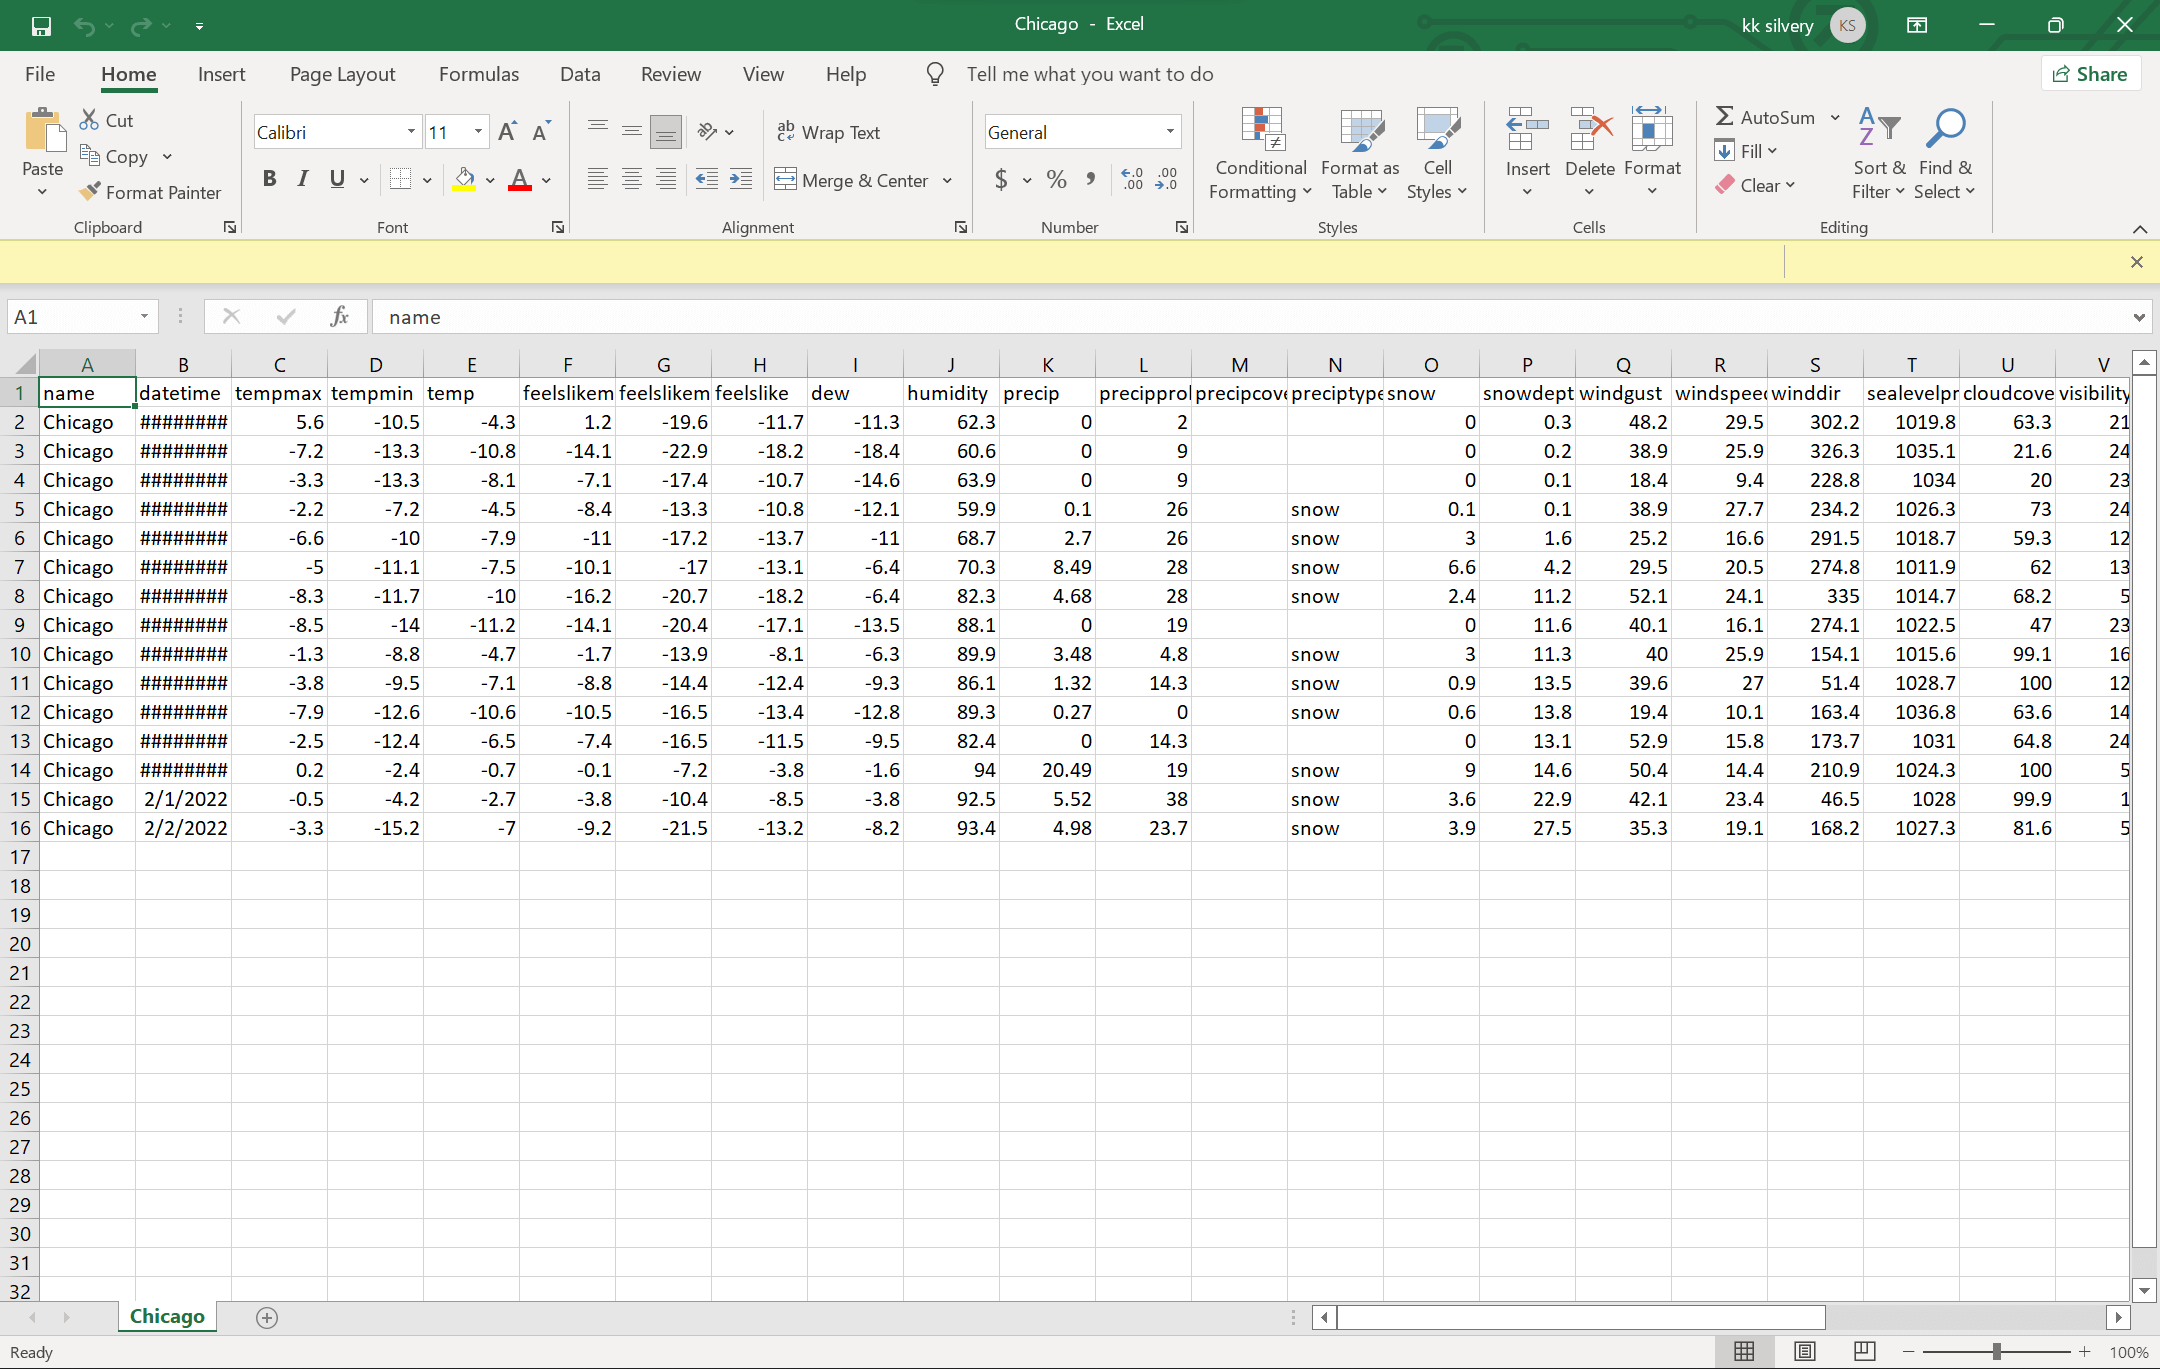
MS Office 2019 has no problems viewing the document in MS Excel in the Windows 11 machine. The CSV format is viewable on any office application such as WPS Office, LibreOffice, Microsoft Office, and others. You don’t have to worry about the CSV file format compatibility issues and it is viewable on any office suite.
Multiple Integration Options
Visual Crossing is designed for weather projects, and they have added tools to integrate the service for apps, code, and web-based applications. The API service works, and you can add a weather widget in your smartphone app without issues. Let me show you how many integration options you have in the VC dashboard.
- Login into your account and click on “Query Builder” from the main menu.
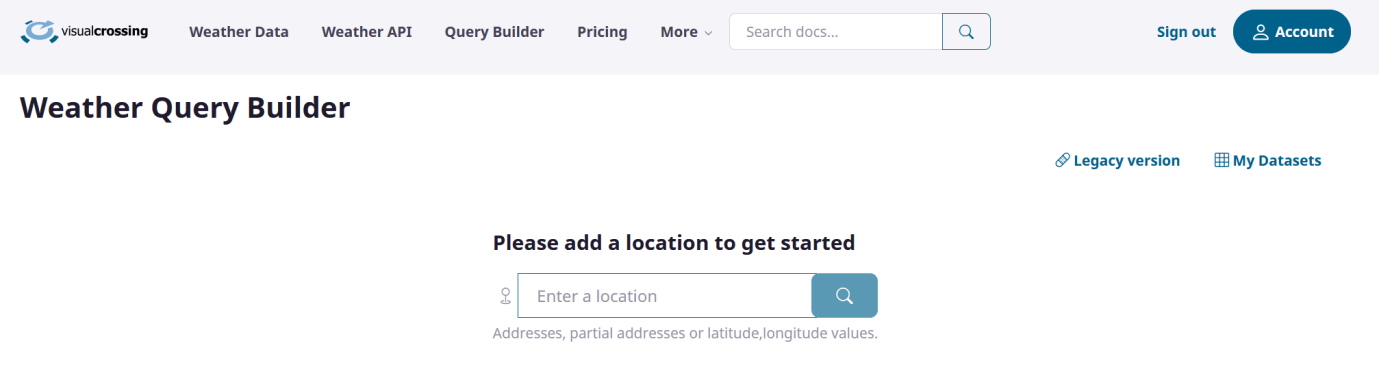
- Type the location and click on the search button.
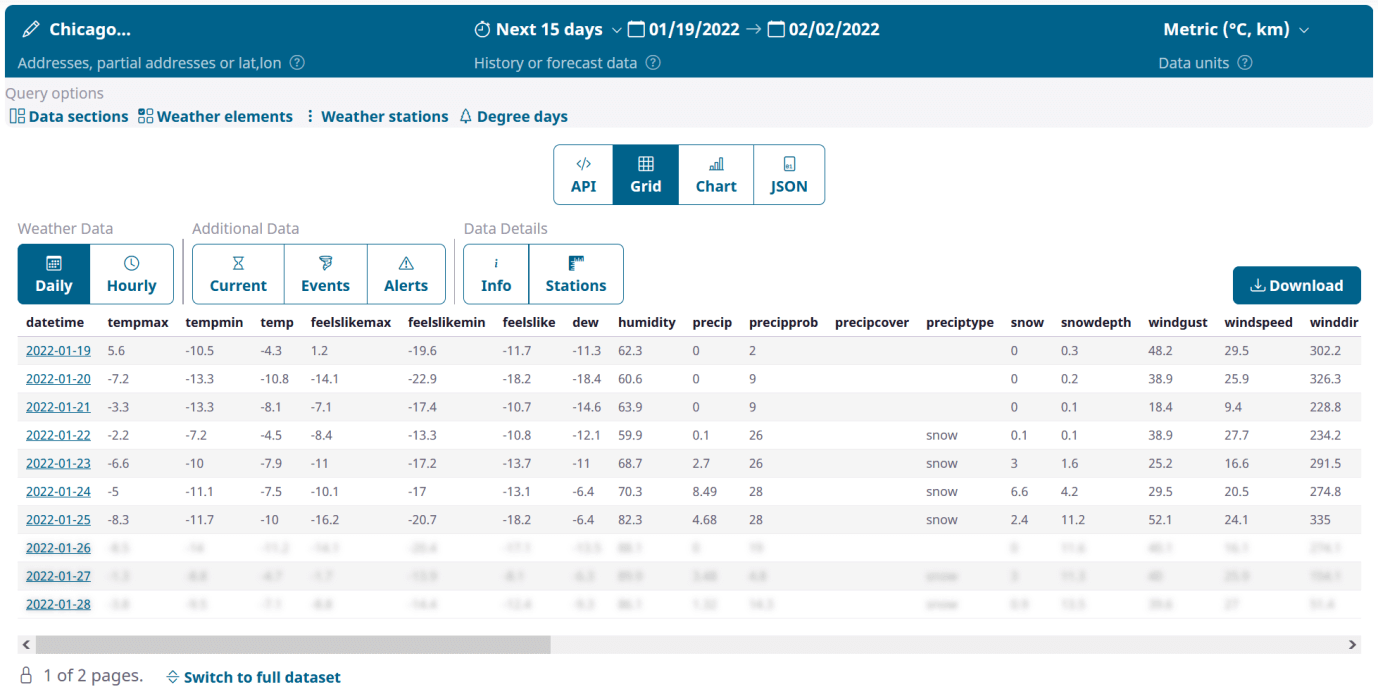
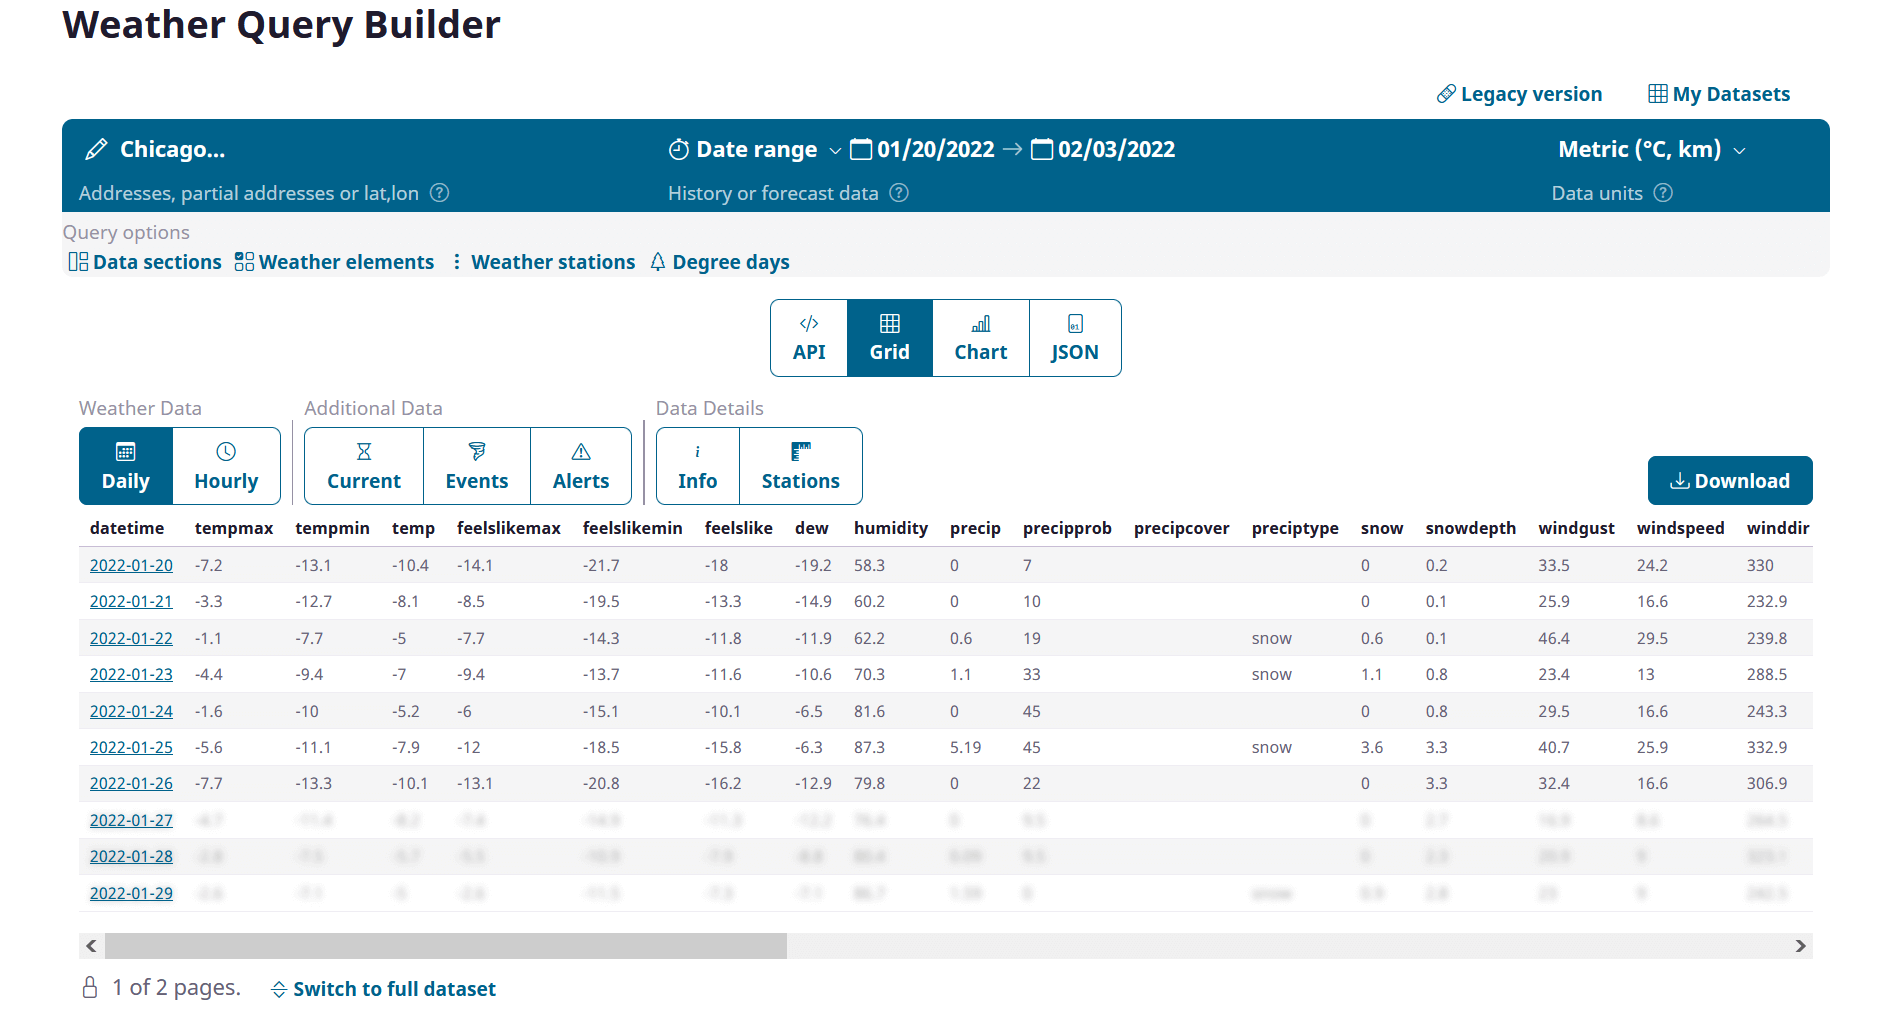
3. Now, you have the weather data on the screen.
You can filter the data on an hourly or daily basis and continue viewing the report.
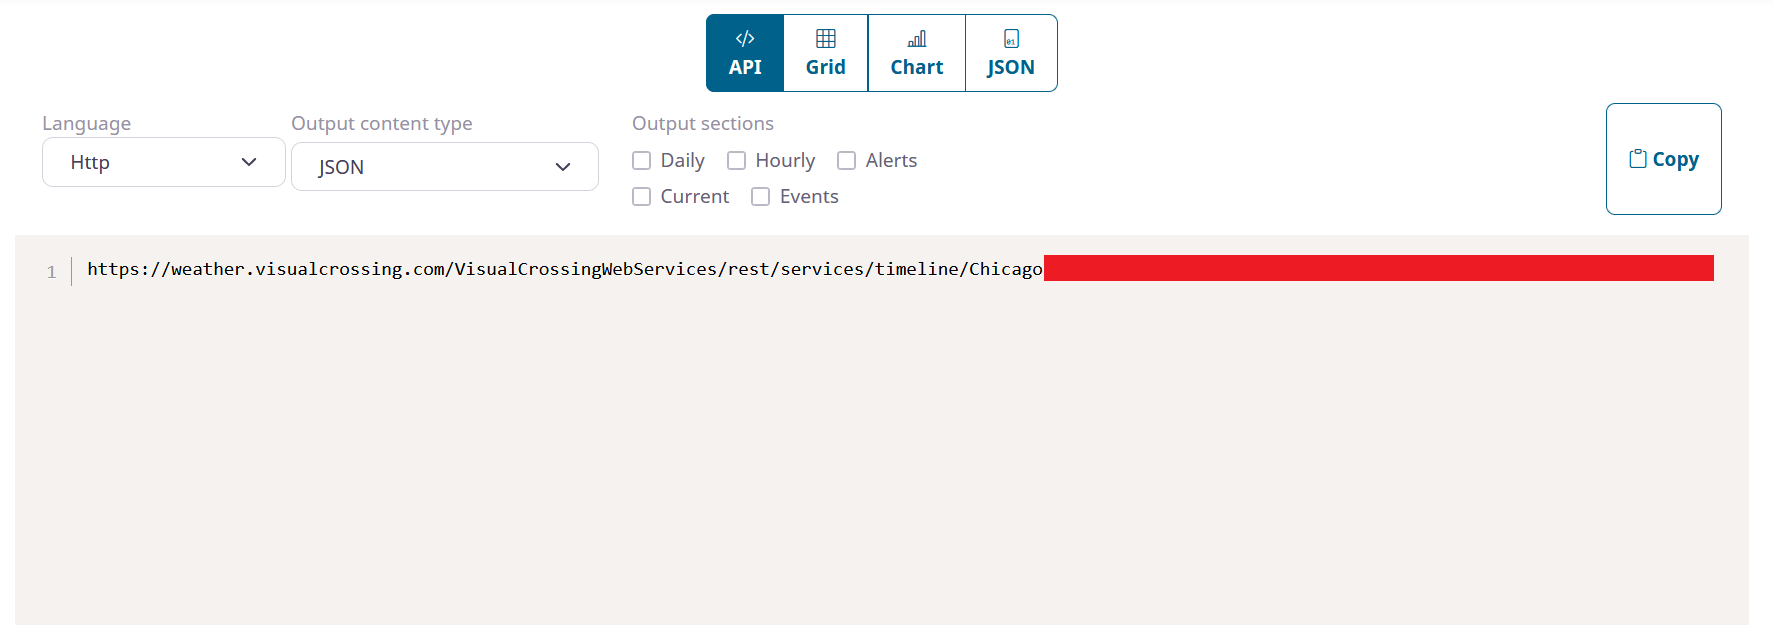
- Click on the API icon, and you can view the API code.
- Click on the “Chat” to view the report in a chart.
- You can copy the code in JSON language and apply it in the Android or iOS app.
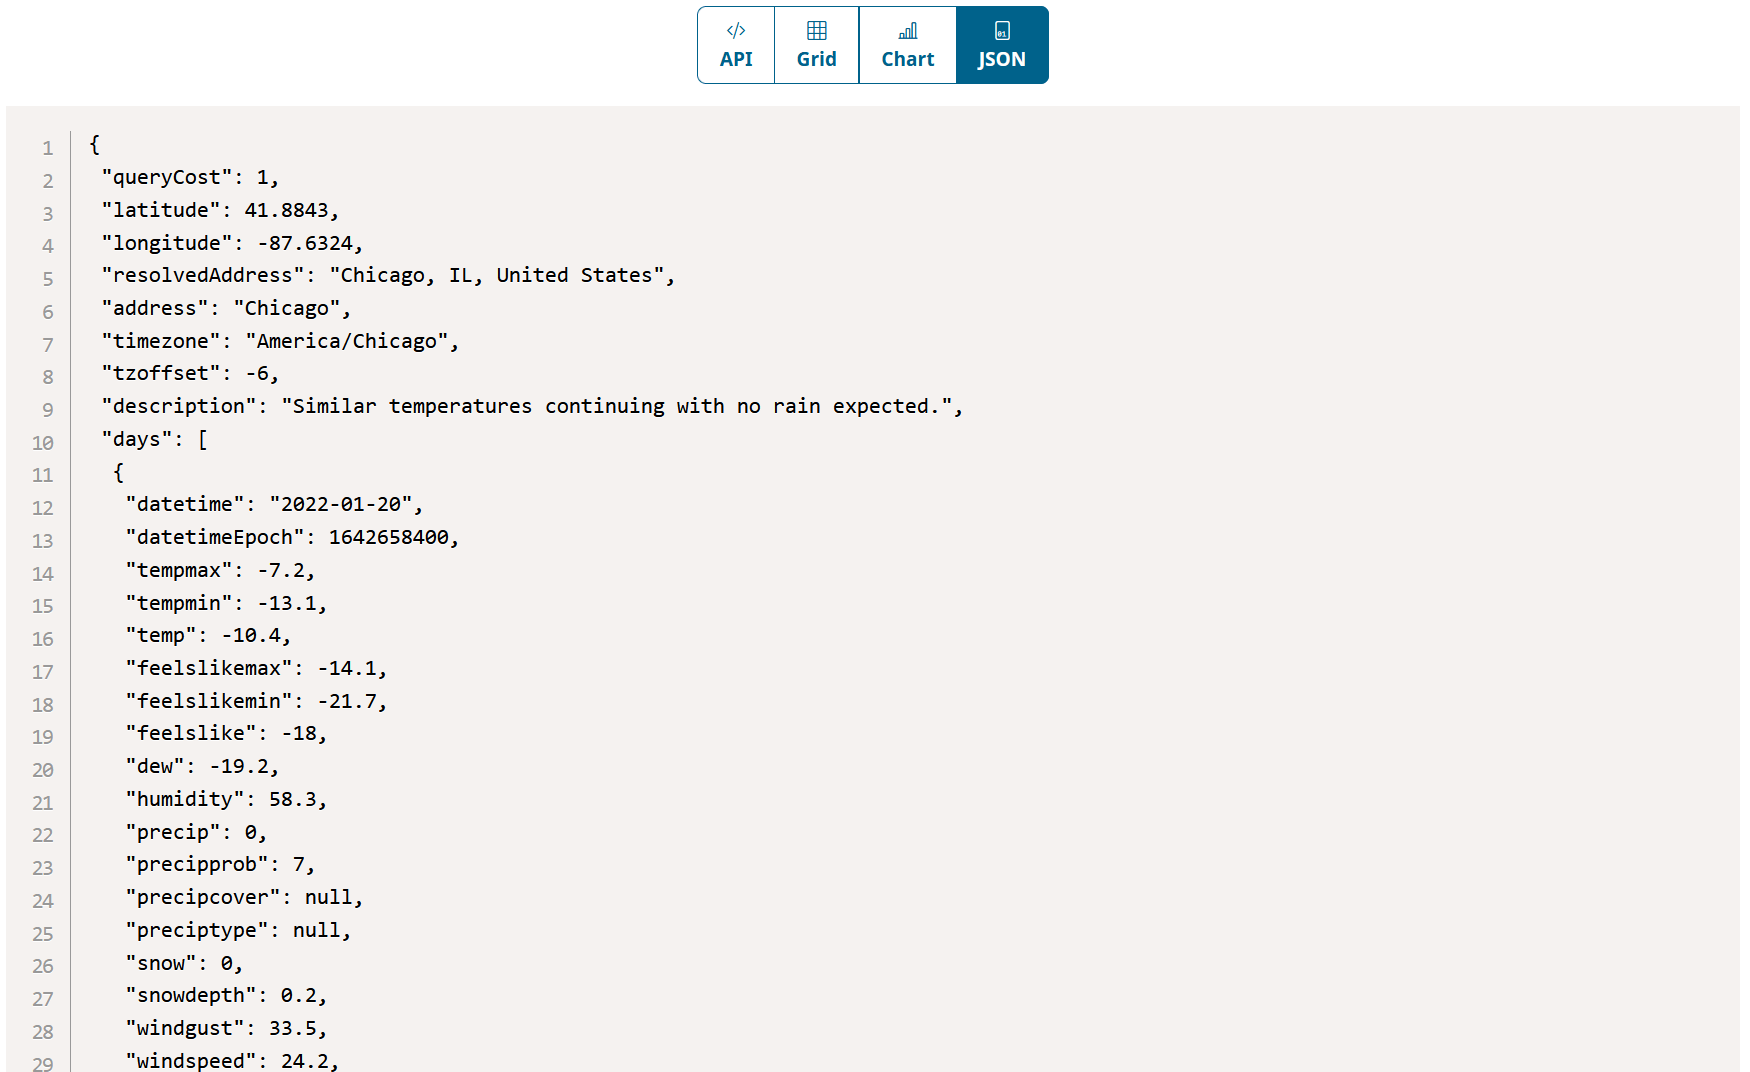
JSON language is used in a wide range of applications, so you shouldn’t have complications integrating the code in the app. You got multiple integration options in the dashboard, so you don’t have to worry about the API limitations.
Free Plan
New users don’t have to pay a single penny to get started and experience the weather data services. The free plan has limitations, but it’s a good package for individuals and academic projects. Corporate companies can test the weather data services including API/JSON code in the app or web-based application in advance.
You should try the Visual Crossing services, and I will give you a few reasons to give a shot.
a.You don’t have to enter the credit card or debit card details. Yes, you don’t need to save the card details or payment mode in advance and get started without it.
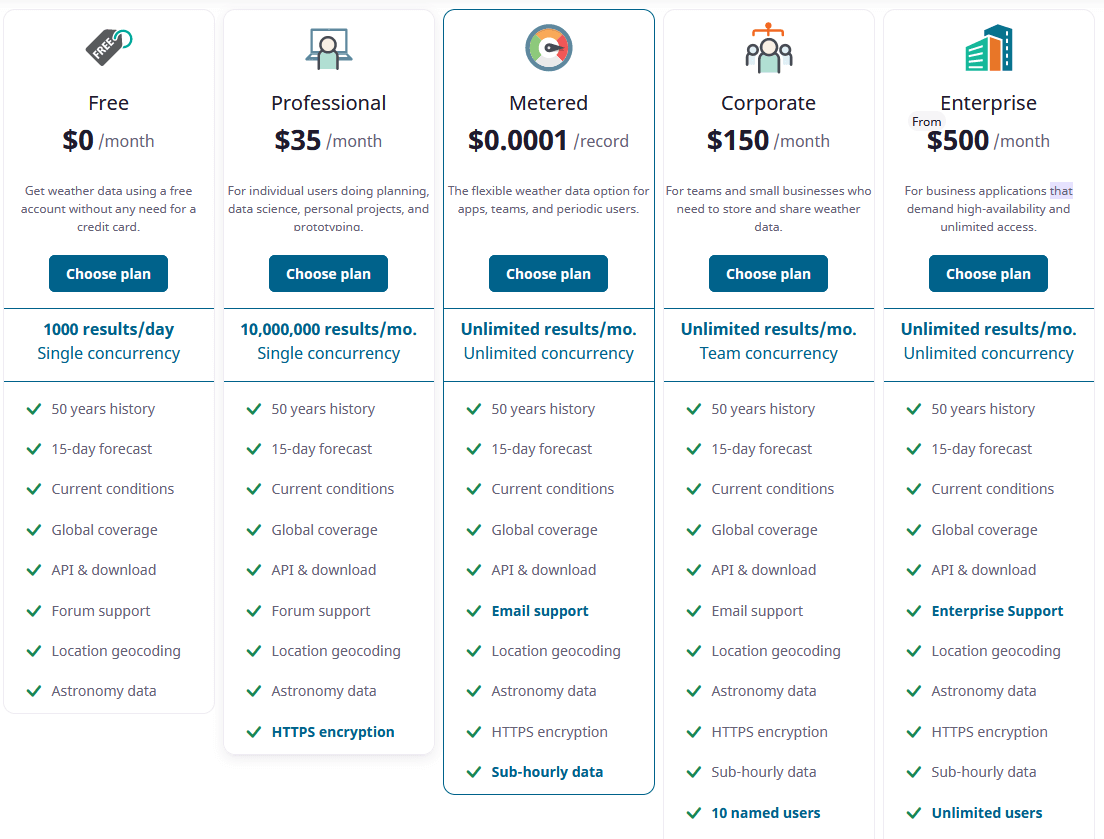
b.The free plan includes 50 years of history and 1000 results per day.
c.You need a valid email address to create an account and activate the account.
Visual Crossing pricing starts from $35 per month in the Professional plan and $0.0001/record in Metered plan.
Sign up for Visual Crossing free account
UPDATE : Visual Crossing now also has a electricity or power consumption page with which you compare your power consumption in winter days.
Bottom Line
Visual Crossing is a go-to weather data service provider, and they have an established infrastructure in place. New visitors don’t have to risk paying in a plan to test the services, and all you need is a valid email account to create a free account. Let us know what do you think about Visual Crossing in the comment section below.